What delight actually means (hint: it’s not the confetti)
Before we talk about measuring delight, we need to agree on what it is, because most teams don’t. They treat delight as a vibe. A nice-to-have. The sprinkles on top of a product that “actually works.”
That is totaly wrong.
A product delights someone when it does two things at once. It helps them accomplish something real, and it makes them feel good while doing it. Users can be driven to use a product by functional motivators, the practical job they need done, and emotional motivators, how they want to feel, for themselves or in front of others, while getting it done. Put those two axes on a grid and you get four outcomes:
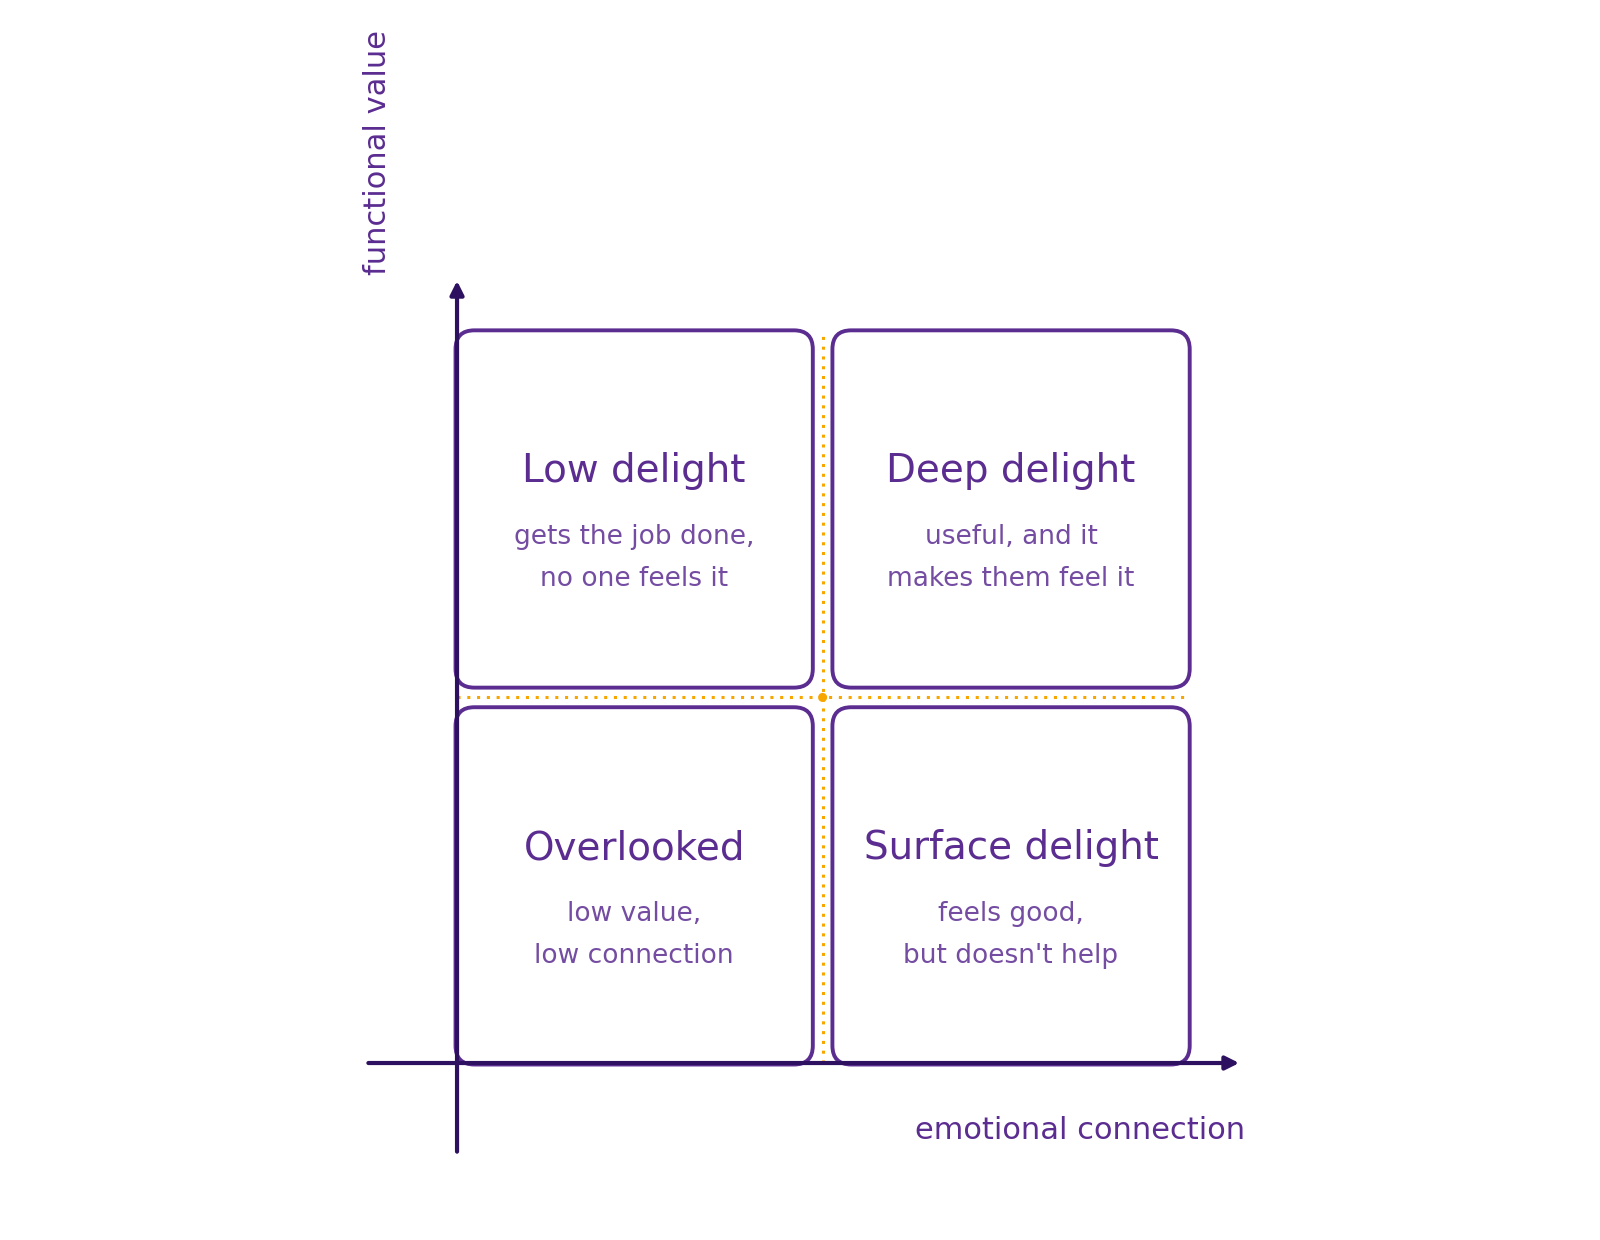
A feature that nails the job but leaves the emotional side untouched lands in low delight. Competent, forgettable. A feature that’s all emotional flourish with no functional payoff is surface delight. Charming, but it rarely survives a roadmap review once someone asks what it’s actually for. The features that build loyalty sit in the top right: useful enough to matter and warm enough to remember. That’s deep delight. More details can be found here.
This framing matters for the rest of the article, because it explains why delight has such a bad reputation as a metric. If you only think of delight as the fun part, an easter egg, a confetti animation, a clever empty state, of course it feels too soft to measure. But if delight is really about whether someone feels good while getting real value, it’s not soft at all. It’s a specific, describable property of an experience, and specific things can be tracked.
“Too subjective to measure” is the excuse companies hide behind
Ask a room full of product people whether delight can be measured, and a good chunk will say no. Too fuzzy, too personal, too dependent on context. NPS and CSAT tend to get treated as the ceiling here: if you’re already tracking those, you’ve done your due diligence on “happiness.”
But NPS mostly tells you a number moved, not why. And CSAT measures the absence of frustration more than the presence of joy. Being “satisfied” with something is the emotional equivalent of calling a meal edible. Nobody raves about edible.
The companies that took delight seriously didn’t stop at that ceiling. They built their own instruments for it. Here are three worth learning from, and a rough sense of when each one earns its keep.
In this article, I’ll share three concrete examples of companies that successfully found ways to measure delight. Because when you truly care about delight, you measure it.
Google’s HaTS: the survey built to out-diagnose NPS
At Google, while working on products like Chrome and Google Meet, I used a metric called HaTS, the Happiness Tracking Survey, to measure user attitudes at scale and on an ongoing basis rather than as a one-off pulse check.
It isn’t a single question. It’s a structured, funnel-shaped survey. It starts broad, overall satisfaction and likelihood to recommend, then narrows into open-ended questions about frustrations and favorite aspects of the product, then drills into satisfaction with specific attributes like ease of use, reliability, visual appeal, and speed, plus specific tasks. The ordering isn’t arbitrary. Going broad to narrow avoids priming people’s answers and builds a bit of rapport before you ask anything more sensitive. The sampling is deliberately rigorous too. The same person doesn’t get surveyed again for twelve weeks, the target sample size sits between 400 and 1,000 responses to keep the error margin tight, and the survey never launches from an interruptive pop-up.
What makes HaTS genuinely different from NPS is that it doesn’t just hand you a number that moved. It gives you a place to look. If satisfaction dips, you can trace it back to a specific attribute or task instead of guessing.
GitHub’s DUUF: the metric that refuses to average itself away
At GitHub, during the beta of Projects, researcher Jared S. Bauer, PhD, developed a metric called DUUF: delight, usability, utility, and fit. It builds on two older, well-validated ideas. The Technology Acceptance Model, which established that perceived usefulness and perceived ease of use predict whether people actually adopt something, and the product-market-fit question popularized by Sean Ellis: how disappointed would you be if you could no longer use this product?
DUUF’s most interesting design choice is that it refuses to collapse those four dimensions into a single blended score. Delight, usability, utility, and fit get tracked and reported separately, because each tells you something different, and because they matter at different points in a product’s life. Bauer’s team found that early in a beta, delight, utility, and fit predict adoption much more strongly than usability does. People will forgive some rough edges if the thing is genuinely useful and makes them feel something. Usability only becomes make-or-break once the product matures and expectations rise.
In practice, DUUF gets measured through a short survey (agree or disagree statements on usefulness, ease of use, and “appeal,” plus the disappointment question) and reinforced qualitatively, by asking beta users directly what they find delightful and paying close attention to unsolicited praise, which tends to point straight at what to double down on.
Lovable’s Score: catching the products people only tolerate
The most recent example comes from Elena Verna’s work at Lovable. Her starting observation is blunt: usage, conversion, retention, and revenue can all look healthy on a product people merely tolerate, because their boss told them to use it, or switching feels annoying, or there’s no better alternative yet. None of that is love. And the moment a real alternative shows up, tolerated products lose.
So alongside their usage-based North Star metric, Lovable built a qualitative companion, the Lovable Score. It’s a composite that combines several existing signals, NPS, the Sean Ellis product-market-fit disappointment question, CSAT, and a measure of ease of use, collected on a regular cadence, standardized, and weighted according to what the team cares about most at that stage of the company. It isn’t meant to replace their quantitative North Star. It’s a check against it, a way to catch products that look healthy on paper but aren’t actually loved.
The pattern none of them talk about out loud
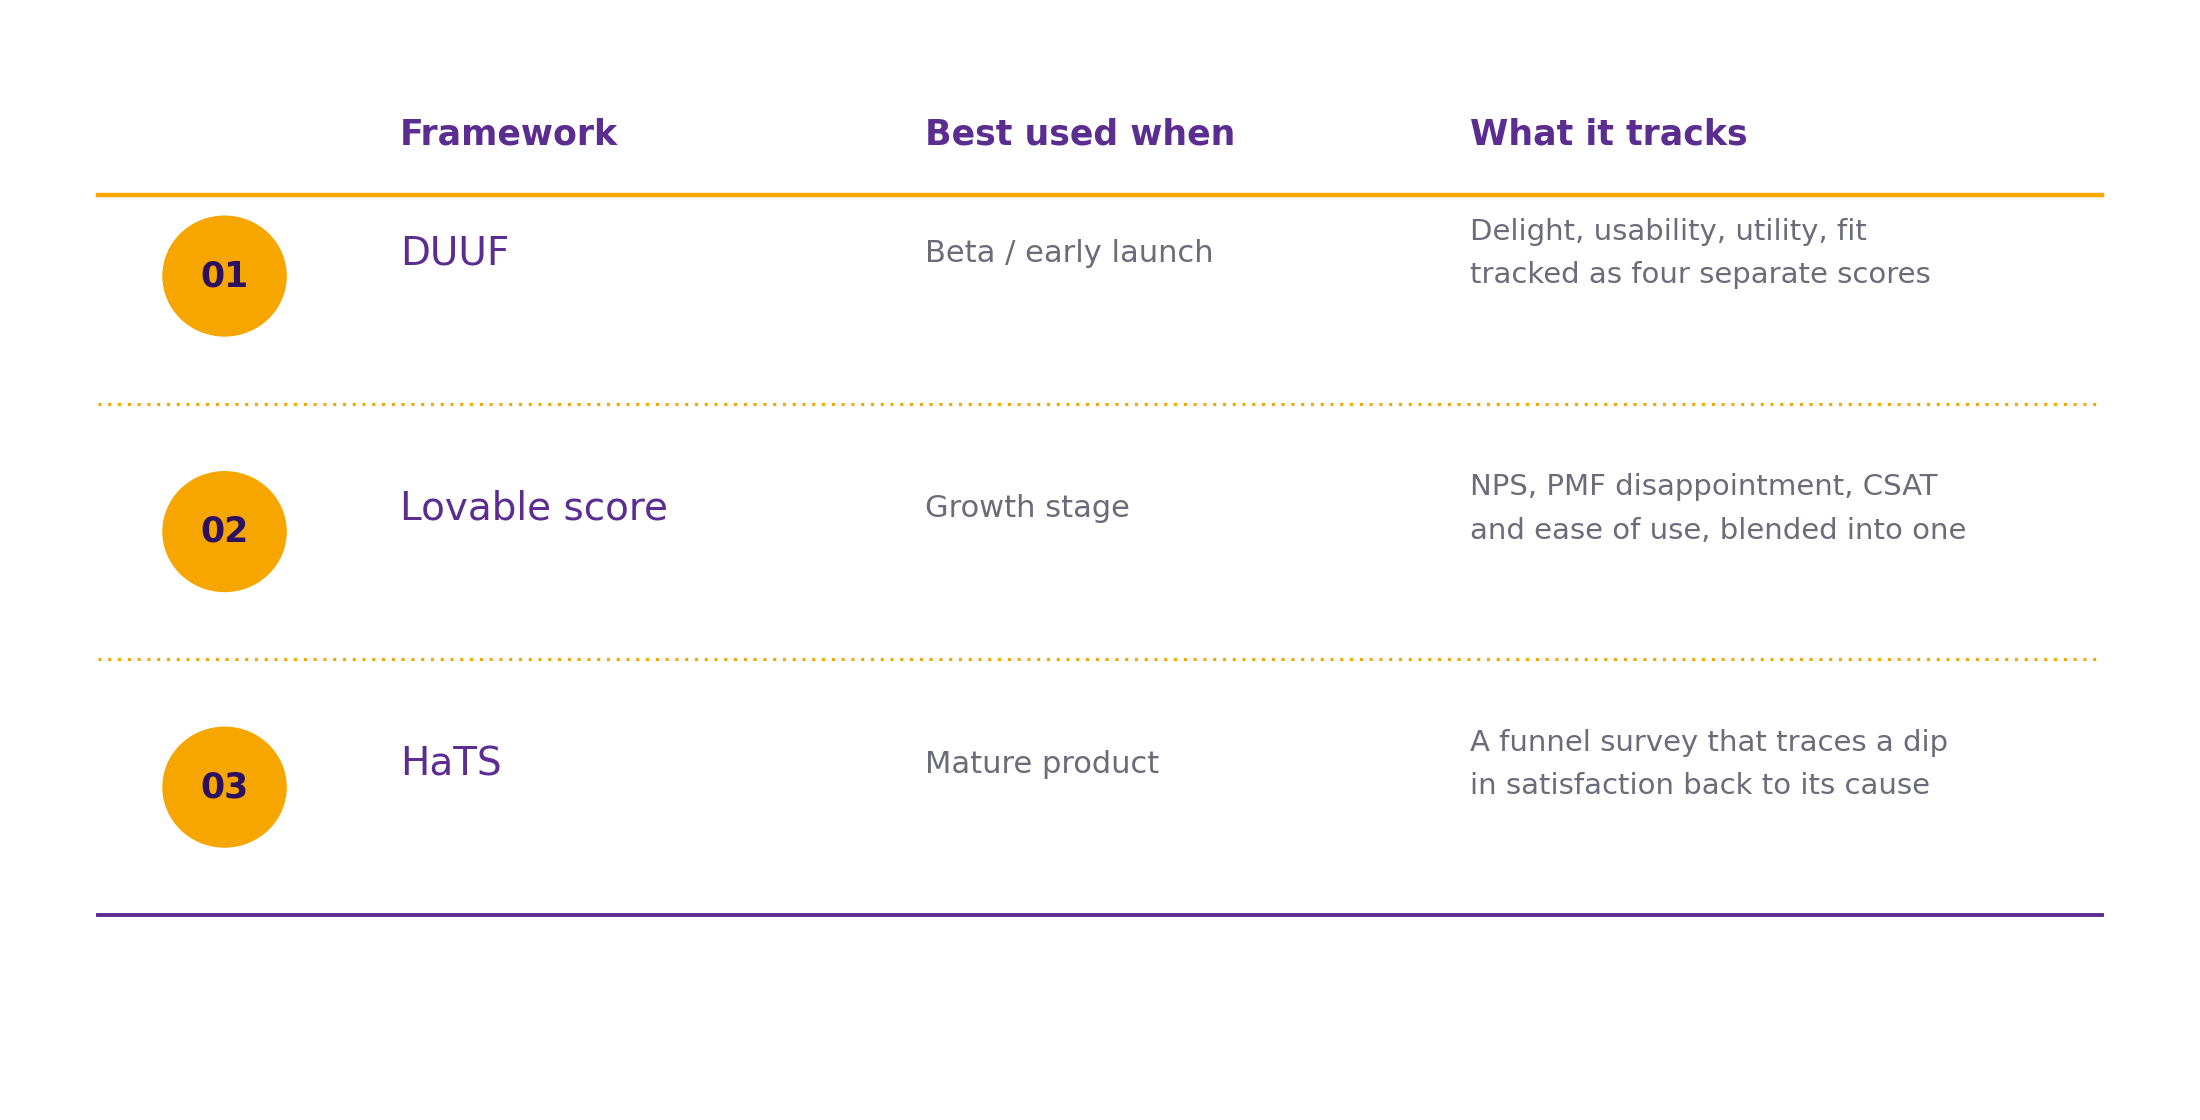
Line them up and a pattern shows up fast. None of them lean on a single number. HaTS is a funnel of questions, DUUF is four separate dimensions, the Lovable score is an explicit composite. Delight resists being reduced to one metric because it isn’t one thing. It’s several forces, usefulness, ease, appeal, emotional payoff, that happen to correlate.
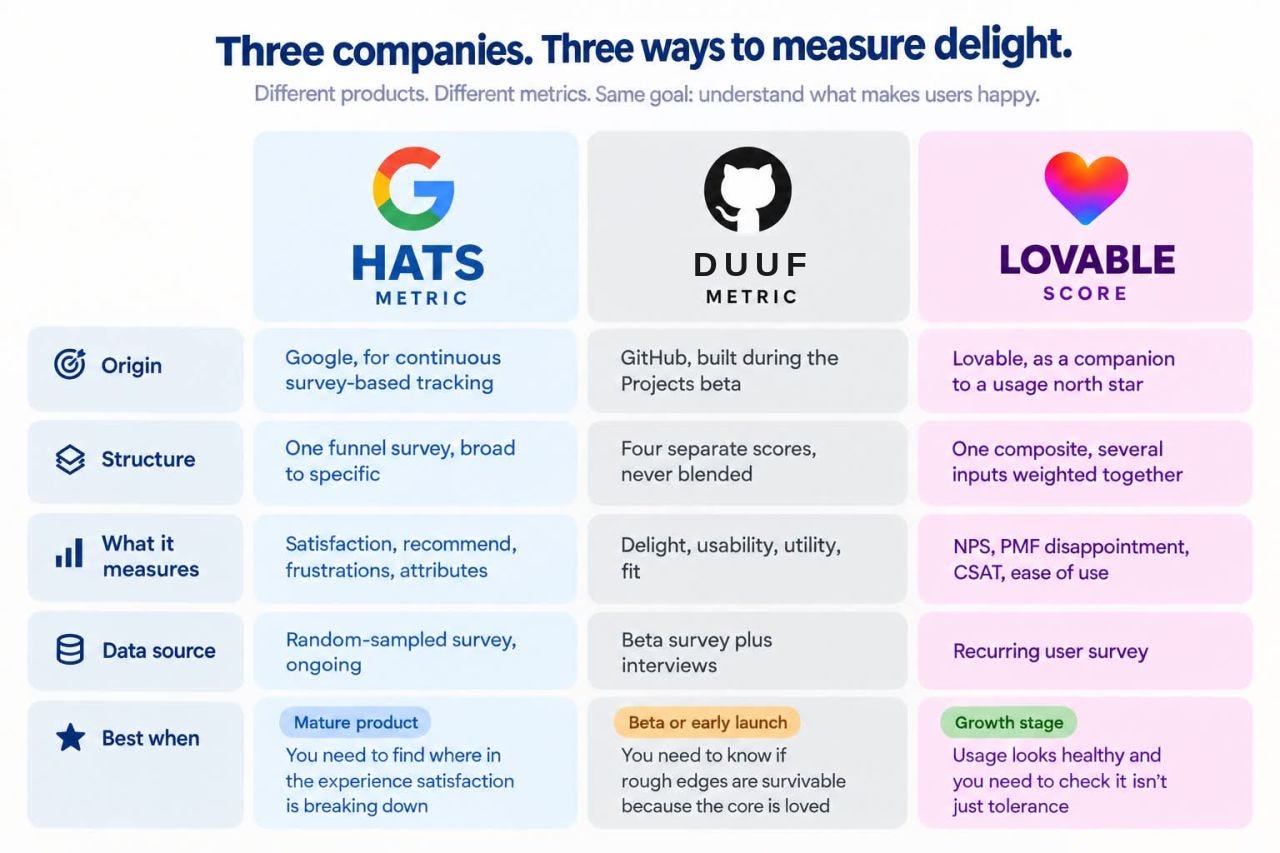
They also don’t throw out NPS and CSAT so much as absorb them. Each treats those older metrics as ingredients inside something more diagnostic, and each pairs a quantitative score with room for an open-ended answer or a direct interview, which is usually where the actual product decision lives. And timing matters more than any of the three companies let on up front. GitHub’s finding that delight and fit outweigh usability early on is a good reminder that measuring delight isn’t just about which questions you ask. It’s about when you weight the answers differently.
Where to start tomorrow morning
If you’re building your own version of this, you don’t need to invent a new framework from scratch. Start with considering this split: functional versus emotional motivators, to make sure your survey questions and interview guides are actually probing both. Then borrow the mechanics: HaTS’s broad-to-narrow funnel, DUUF’s discipline of keeping dimensions separate instead of blending them into mush, and Lovable’s instinct to run this as an ongoing companion metric rather than a one-time study.
The common thread across all three companies isn’t the specific wording of their surveys. It’s that none of them accepted “too subjective to measure” as an answer. They treated delight as something with enough shape to interrogate, and built instruments precise enough to catch it. That’s the real takeaway. Delight isn’t harder to measure than any other product outcome. It’s just been measured less, by people who didn’t think it was worth the effort.
For more delight about Integrating Delight into your company: